Phase Detection
Prior to initiating this procedure you must have completed the steps outlined in Basic EFM Operation.
- In the Cantilever Tune panel of the Setup view, click the Autotune button to tune your cantilever. If you want to see the phase graph, click the Manual Tune button or the Tune icon in the workflow toolbar.
- If necessary, set Start Frequency and End Frequency to appropriate values for your cantilever (e.g., for 225 µm MFM cantilevers, set Start Frequency to 40 kHz and End Frequency to 100 kHz).
- Click the Auto Tune button.
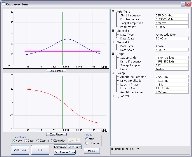
Two curves appear on the Cantilever Tune graph: the amplitude curve on top (the blue line in the image below), and the phase curve (red line) below:
(Hover over the image to view larger)
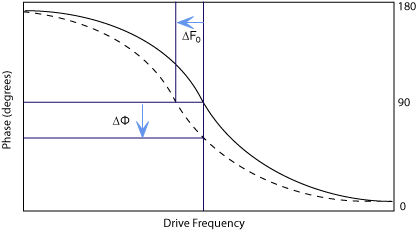
NOTE: The phase should decrease with increasing frequency and cross the center line (0° point) at the peak frequency. The phase curve then correctly reflects the phase lag between the drive and the cantilever response. Gradients in the electric force cause a shift ΔF
0 in the resonance frequency. Resonance shifts also give rise to phase shifts, ΔΦ, used to generate an image of the electric force gradients:
- Exit Auto Tune.
- Engage the AFM and make the necessary adjustments to obtain a good topography (Height) image on Channel 1.
- In the Interleave panel, set:
- Interleave Mode to Lift
- Lift Start Height to 0 nm
- Lift Scan Height to 100 nm (can later be optimized)
- Set the remaining Interleave parameters (, , , and ) to the main Feedback values. This can be done by setting the flags to the left of each parameter to “off” (grayed).
- Set the Channel 3 Data Type to Phase and choose Retrace for the scan Line Direction on both Channel 1 and 3 images.
- Set the Channel 3 Scan Line to Interleave to display interleave data. This screen should now display the cantilever phase change due to electrical force gradients from the sample in the right image and topography in the left image.
NOTE: If a voltage is being applied to the tip or sample, we recommend to apply it only during the Interleave line, if feasible. Set Tip Bias or Sample Bias to the desired voltage in the Interleave panel. In the Feedback panel, set either Tip Bias Control or Sample Bias Control to Ground.
- Optimize the Lift Scan Height. For high-resolution, make the Lift Scan Height as small as possible without crashing the tip into the surface.
 Related Topics
| www.bruker.com
|
Bruker Corporation |
| www.brukerafmprobes.com
|
112 Robin Hill Rd. |
| nanoscaleworld.bruker-axs.com/nanoscaleworld/
|
Santa Barbara, CA 93117 |
| |
|
| |
Customer Support: (800) 873-9750 |
| |
Copyright 2010, 2011. All Rights Reserved. |
Open topic with navigation
 , Drive Amplitude